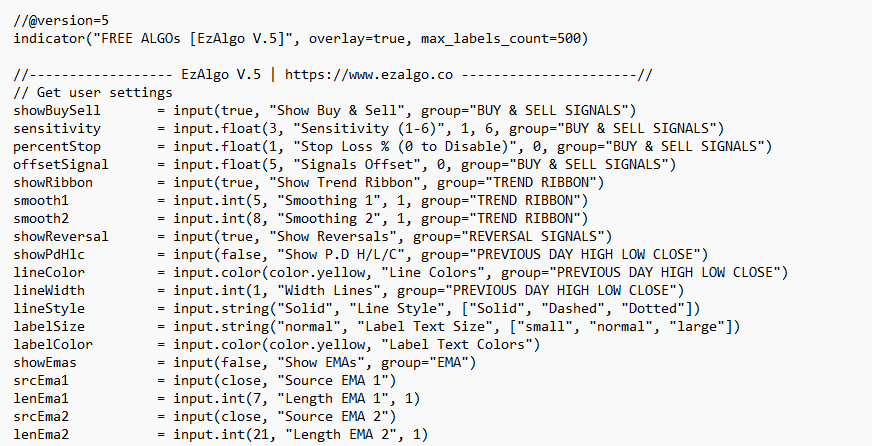
//@version=5
indicator(“FREE ALGOs [EzAlgo V.5]”, overlay=true, max_labels_count=500)
//—————— EzAlgo V.5 | https://www.ezalgo.co ———————-//
// Get user settings
showBuySell = input(true, “Show Buy & Sell”, group=”BUY & SELL SIGNALS”)
sensitivity = input.float(3, “Sensitivity (1-6)”, 1, 6, group=”BUY & SELL SIGNALS”)
percentStop = input.float(1, “Stop Loss % (0 to Disable)”, 0, group=”BUY & SELL SIGNALS”)
offsetSignal = input.float(5, “Signals Offset”, 0, group=”BUY & SELL SIGNALS”)
showRibbon = input(true, “Show Trend Ribbon”, group=”TREND RIBBON”)
smooth1 = input.int(5, “Smoothing 1″, 1, group=”TREND RIBBON”)
smooth2 = input.int(8, “Smoothing 2″, 1, group=”TREND RIBBON”)
showReversal = input(true, “Show Reversals”, group=”REVERSAL SIGNALS”)
showPdHlc = input(false, “Show P.D H/L/C”, group=”PREVIOUS DAY HIGH LOW CLOSE”)
lineColor = input.color(color.yellow, “Line Colors”, group=”PREVIOUS DAY HIGH LOW CLOSE”)
lineWidth = input.int(1, “Width Lines”, group=”PREVIOUS DAY HIGH LOW CLOSE”)
lineStyle = input.string(“Solid”, “Line Style”, [“Solid”, “Dashed”, “Dotted”])
labelSize = input.string(“normal”, “Label Text Size”, [“small”, “normal”, “large”])
labelColor = input.color(color.yellow, “Label Text Colors”)
showEmas = input(false, “Show EMAs”, group=”EMA”)
srcEma1 = input(close, “Source EMA 1”)
lenEma1 = input.int(7, “Length EMA 1”, 1)
srcEma2 = input(close, “Source EMA 2”)
lenEma2 = input.int(21, “Length EMA 2”, 1)
srcEma3 = input(close, “Source EMA 3”)
lenEma3 = input.int(144, “Length EMA 3”, 1)
showSwing = input(false, “Show Swing Points”, group=”SWING POINTS”)
prdSwing = input.int(10, “Swing Point Period”, 2, group=”SWING POINTS”)
colorPos = input(color.new(color.green, 50), “Positive Swing Color”)
colorNeg = input(color.new(color.red, 50), “Negative Swing Color”)
showDashboard = input(true, “Show Dashboard”, group=”TREND DASHBOARD”)
locationDashboard = input.string(“Middle Right”, “Table Location”, [“Top Right”, “Middle Right”, “Bottom Right”, “Top Center”, “Middle Center”, “Bottom Center”, “Top Left”, “Middle Left”, “Bottom Left”], group=”TREND DASHBOARD”)
tableTextColor = input(color.white, “Table Text Color”, group=”TREND DASHBOARD”)
tableBgColor = input(#2A2A2A, “Table Background Color”, group=”TREND DASHBOARD”)
sizeDashboard = input.string(“Normal”, “Table Size”, [“Large”, “Normal”, “Small”, “Tiny”], group=”TREND DASHBOARD”)
showRevBands = input.bool(true, “Show Reversal Bands”, group=”REVERSAL BANDS”)
lenRevBands = input.int(30, “Length”, group=”REVERSAL BANDS”)
// Functions
smoothrng(x, t, m) =>
wper = t * 2 – 1
avrng = ta.ema(math.abs(x – x[1]), t)
smoothrng = ta.ema(avrng, wper) * m
rngfilt(x, r) =>
rngfilt = x
rngfilt := x > nz(rngfilt[1]) ? x – r < nz(rngfilt[1]) ? nz(rngfilt[1]) : x – r : x + r > nz(rngfilt[1]) ? nz(rngfilt[1]) : x + r
percWidth(len, perc) => (ta.highest(len) – ta.lowest(len)) * perc / 100
securityNoRep(sym, res, src) => request.security(sym, res, src, barmerge.gaps_off, barmerge.lookahead_on)
swingPoints(prd) =>
pivHi = ta.pivothigh(prd, prd)
pivLo = ta.pivotlow (prd, prd)
last_pivHi = ta.valuewhen(pivHi, pivHi, 1)
last_pivLo = ta.valuewhen(pivLo, pivLo, 1)
hh = pivHi and pivHi > last_pivHi ? pivHi : na
lh = pivHi and pivHi < last_pivHi ? pivHi : na
hl = pivLo and pivLo > last_pivLo ? pivLo : na
ll = pivLo and pivLo < last_pivLo ? pivLo : na
[hh, lh, hl, ll]
f_chartTfInMinutes() =>
float _resInMinutes = timeframe.multiplier * (
timeframe.isseconds ? 1 :
timeframe.isminutes ? 1. :
timeframe.isdaily ? 60. * 24 :
timeframe.isweekly ? 60. * 24 * 7 :
timeframe.ismonthly ? 60. * 24 * 30.4375 : na)
f_kc(src, len, sensitivity) =>
basis = ta.sma(src, len)
span = ta.atr(len)
[basis + span * sensitivity, basis – span * sensitivity]
wavetrend(src, chlLen, avgLen) =>
esa = ta.ema(src, chlLen)
d = ta.ema(math.abs(src – esa), chlLen)
ci = (src – esa) / (0.015 * d)
wt1 = ta.ema(ci, avgLen)
wt2 = ta.sma(wt1, 3)
[wt1, wt2]
f_top_fractal(src) => src[4] < src[2] and src[3] < src[2] and src[2] > src[1] and src[2] > src[0]
f_bot_fractal(src) => src[4] > src[2] and src[3] > src[2] and src[2] < src[1] and src[2] < src[0]
f_fractalize (src) => f_top_fractal(src) ? 1 : f_bot_fractal(src) ? -1 : 0
f_findDivs(src, topLimit, botLimit) =>
fractalTop = f_fractalize(src) > 0 and src[2] >= topLimit ? src[2] : na
fractalBot = f_fractalize(src) < 0 and src[2] <= botLimit ? src[2] : na
highPrev = ta.valuewhen(fractalTop, src[2], 0)[2]
highPrice = ta.valuewhen(fractalTop, high[2], 0)[2]
lowPrev = ta.valuewhen(fractalBot, src[2], 0)[2]
lowPrice = ta.valuewhen(fractalBot, low[2], 0)[2]
bearSignal = fractalTop and high[2] > highPrice and src[2] < highPrev
bullSignal = fractalBot and low[2] < lowPrice and src[2] > lowPrev
[bearSignal, bullSignal]
// Get components
source = close
smrng1 = smoothrng(source, 27, 1.5)
smrng2 = smoothrng(source, 55, sensitivity)
smrng = (smrng1 + smrng2) / 2
filt = rngfilt(source, smrng)
up = 0.0, up := filt > filt[1] ? nz(up[1]) + 1 : filt < filt[1] ? 0 : nz(up[1])
dn = 0.0, dn := filt < filt[1] ? nz(dn[1]) + 1 : filt > filt[1] ? 0 : nz(dn[1])
bullCond = bool(na), bullCond := source > filt and source > source[1] and up > 0 or source > filt and source < source[1] and up > 0
bearCond = bool(na), bearCond := source < filt and source < source[1] and dn > 0 or source < filt and source > source[1] and dn > 0
lastCond = 0, lastCond := bullCond ? 1 : bearCond ? -1 : lastCond[1]
bull = bullCond and lastCond[1] == -1
bear = bearCond and lastCond[1] == 1
countBull = ta.barssince(bull)
countBear = ta.barssince(bear)
trigger = nz(countBull, bar_index) < nz(countBear, bar_index) ? 1 : 0
ribbon1 = ta.sma(close, smooth1)
ribbon2 = ta.sma(close, smooth2)
rsi = ta.rsi(close, 21)
rsiOb = rsi > 70 and rsi > ta.ema(rsi, 10)
rsiOs = rsi < 30 and rsi < ta.ema(rsi, 10)
dHigh = securityNoRep(syminfo.tickerid, “D”, high [1])
dLow = securityNoRep(syminfo.tickerid, “D”, low [1])
dClose = securityNoRep(syminfo.tickerid, “D”, close[1])
ema1 = ta.ema(srcEma1, lenEma1)
ema2 = ta.ema(srcEma2, lenEma2)
ema3 = ta.ema(srcEma3, lenEma3)
[hh, lh, hl, ll] = swingPoints(prdSwing)
ema = ta.ema(close, 144)
emaBull = close > ema
equal_tf(res) => str.tonumber(res) == f_chartTfInMinutes() and not timeframe.isseconds
higher_tf(res) => str.tonumber(res) > f_chartTfInMinutes() or timeframe.isseconds
too_small_tf(res) => (timeframe.isweekly and res==”1″) or (timeframe.ismonthly and str.tonumber(res) < 10)
securityNoRep1(sym, res, src) =>
bool bull_ = na
bull_ := equal_tf(res) ? src : bull_
bull_ := higher_tf(res) ? request.security(sym, res, src, barmerge.gaps_off, barmerge.lookahead_on) : bull_
bull_array = request.security_lower_tf(syminfo.tickerid, higher_tf(res) ? str.tostring(f_chartTfInMinutes()) + (timeframe.isseconds ? “S” : “”) : too_small_tf(res) ? (timeframe.isweekly ? “3” : “10”) : res, src)
if array.size(bull_array) > 1 and not equal_tf(res) and not higher_tf(res)
bull_ := array.pop(bull_array)
array.clear(bull_array)
bull_
TF1Bull = securityNoRep1(syminfo.tickerid, “1” , emaBull)
TF3Bull = securityNoRep1(syminfo.tickerid, “3” , emaBull)
TF5Bull = securityNoRep1(syminfo.tickerid, “5” , emaBull)
TF15Bull = securityNoRep1(syminfo.tickerid, “15” , emaBull)
TF30Bull = securityNoRep1(syminfo.tickerid, “30” , emaBull)
TF60Bull = securityNoRep1(syminfo.tickerid, “60” , emaBull)
TF120Bull = securityNoRep1(syminfo.tickerid, “120” , emaBull)
TF240Bull = securityNoRep1(syminfo.tickerid, “240” , emaBull)
TF480Bull = securityNoRep1(syminfo.tickerid, “480” , emaBull)
TFDBull = securityNoRep1(syminfo.tickerid, “1440”, emaBull)
[upperKC1, lowerKC1] = f_kc(close, lenRevBands, 3)
[upperKC2, lowerKC2] = f_kc(close, lenRevBands, 4)
[upperKC3, lowerKC3] = f_kc(close, lenRevBands, 5)
[upperKC4, lowerKC4] = f_kc(close, lenRevBands, 6)
[wt1, wt2] = wavetrend(hlc3, 9, 12)
[wtDivBear1, wtDivBull1] = f_findDivs(wt2, 15, -40)
[wtDivBear2, wtDivBull2] = f_findDivs(wt2, 45, -65)
wtDivBull = wtDivBull1 or wtDivBull2
wtDivBear = wtDivBear1 or wtDivBear2
// Colors
cyan = #00DBFF, cyan30 = color.new(cyan, 70)
pink = #E91E63, pink30 = color.new(pink, 70)
red = #FF5252, red30 = color.new(red , 70)
// Plot
off = percWidth(300, offsetSignal)
plotshape(showBuySell and bull ? low – off : na, “Buy Label” , shape.labelup , location.absolute, cyan, 0, “Buy” , color.white, size=size.normal)
plotshape(showBuySell and bear ? high + off : na, “Sell Label”, shape.labeldown, location.absolute, pink, 0, “Sell”, color.white, size=size.normal)
plotshape(ta.crossover(wt1, wt2) and wt2 <= -53, “Mild Buy” , shape.xcross, location.belowbar, cyan, size=size.tiny)
plotshape(ta.crossunder(wt1, wt2) and wt2 >= 53, “Mild Sell”, shape.xcross, location.abovebar, pink, size=size.tiny)
plotshape(wtDivBull, “Divergence Buy “, shape.triangleup , location.belowbar, cyan, size=size.tiny)
plotshape(wtDivBear, “Divergence Sell”, shape.triangledown, location.abovebar, pink, size=size.tiny)
barcolor(up > dn ? cyan : pink)
plotshape(showReversal and rsiOs, “Reversal Buy” , shape.diamond, location.belowbar, cyan30, size=size.tiny)
plotshape(showReversal and rsiOb, “Reversal Sell”, shape.diamond, location.abovebar, pink30, size=size.tiny)
lStyle = lineStyle == “Solid” ? line.style_solid : lineStyle == “Dotted” ? line.style_dotted : line.style_dashed
lSize = labelSize == “small” ? size.small : labelSize == “normal” ? size.normal : size.large
dHighLine = showPdHlc ? line.new(bar_index, dHigh, bar_index + 1, dHigh , xloc.bar_index, extend.both, lineColor, lStyle, lineWidth) : na, line.delete(dHighLine[1])
dLowLine = showPdHlc ? line.new(bar_index, dLow , bar_index + 1, dLow , xloc.bar_index, extend.both, lineColor, lStyle, lineWidth) : na, line.delete(dLowLine[1])
dCloseLine = showPdHlc ? line.new(bar_index, dClose, bar_index + 1, dClose, xloc.bar_index, extend.both, lineColor, lStyle, lineWidth) : na, line.delete(dCloseLine[1])
dHighLabel = showPdHlc ? label.new(bar_index + 100, dHigh , “P.D.H”, xloc.bar_index, yloc.price, #000000, label.style_none, labelColor, lSize) : na, label.delete(dHighLabel[1])
dLowLabel = showPdHlc ? label.new(bar_index + 100, dLow , “P.D.L”, xloc.bar_index, yloc.price, #000000, label.style_none, labelColor, lSize) : na, label.delete(dLowLabel[1])
dCloseLabel = showPdHlc ? label.new(bar_index + 100, dClose, “P.D.C”, xloc.bar_index, yloc.price, #000000, label.style_none, labelColor, lSize) : na, label.delete(dCloseLabel[1])
plot(showEmas ? ema1 : na, “EMA 1”, color.green , 2)
plot(showEmas ? ema2 : na, “EMA 2”, color.purple, 2)
plot(showEmas ? ema3 : na, “EMA 3”, color.yellow, 2)
plotshape(showSwing ? hh : na, “”, shape.triangledown, location.abovebar, color.new(color.green, 50), -prdSwing, “HH”, colorPos, false)
plotshape(showSwing ? hl : na, “”, shape.triangleup , location.belowbar, color.new(color.green, 50), -prdSwing, “HL”, colorPos, false)
plotshape(showSwing ? lh : na, “”, shape.triangledown, location.abovebar, color.new(color.red , 50), -prdSwing, “LH”, colorNeg, false)
plotshape(showSwing ? ll : na, “”, shape.triangleup , location.belowbar, color.new(color.red , 50), -prdSwing, “LL”, colorNeg, false)
srcStop = close
atrBand = srcStop * (percentStop / 100)
atrStop = trigger ? srcStop – atrBand : srcStop + atrBand
lastTrade(src) => ta.valuewhen(bull or bear, src, 0)
entry_y = lastTrade(srcStop)
stop_y = lastTrade(atrStop)
tp1_y = (entry_y – lastTrade(atrStop)) * 1 + entry_y
tp2_y = (entry_y – lastTrade(atrStop)) * 2 + entry_y
tp3_y = (entry_y – lastTrade(atrStop)) * 3 + entry_y
labelTpSl(y, txt, color) =>
label labelTpSl = percentStop != 0 ? label.new(bar_index + 1, y, txt, xloc.bar_index, yloc.price, color, label.style_label_left, color.white, size.normal) : na
label.delete(labelTpSl[1])
labelTpSl(entry_y, “Entry: ” + str.tostring(math.round_to_mintick(entry_y)), color.gray)
labelTpSl(stop_y , “Stop Loss: ” + str.tostring(math.round_to_mintick(stop_y)), color.red)
labelTpSl(tp1_y, “Take Profit 1: ” + str.tostring(math.round_to_mintick(tp1_y)), color.green)
labelTpSl(tp2_y, “Take Profit 2: ” + str.tostring(math.round_to_mintick(tp2_y)), color.green)
labelTpSl(tp3_y, “Take Profit 3: ” + str.tostring(math.round_to_mintick(tp3_y)), color.green)
lineTpSl(y, color) =>
line lineTpSl = percentStop != 0 ? line.new(bar_index – (trigger ? countBull : countBear) + 4, y, bar_index + 1, y, xloc.bar_index, extend.none, color, line.style_solid) : na
line.delete(lineTpSl[1])
lineTpSl(entry_y, color.gray)
lineTpSl(stop_y, color.red)
lineTpSl(tp1_y, color.green)
lineTpSl(tp2_y, color.green)
lineTpSl(tp3_y, color.green)
var dashboard_loc = locationDashboard == “Top Right” ? position.top_right : locationDashboard == “Middle Right” ? position.middle_right : locationDashboard == “Bottom Right” ? position.bottom_right : locationDashboard == “Top Center” ? position.top_center : locationDashboard == “Middle Center” ? position.middle_center : locationDashboard == “Bottom Center” ? position.bottom_center : locationDashboard == “Top Left” ? position.top_left : locationDashboard == “Middle Left” ? position.middle_left : position.bottom_left
var dashboard_size = sizeDashboard == “Large” ? size.large : sizeDashboard == “Normal” ? size.normal : sizeDashboard == “Small” ? size.small : size.tiny
var dashboard = showDashboard ? table.new(dashboard_loc, 2, 15, tableBgColor, #000000, 2, tableBgColor, 1) : na
dashboard_cell(column, row, txt, signal=false) => table.cell(dashboard, column, row, txt, 0, 0, signal ? #000000 : tableTextColor, text_size=dashboard_size)
dashboard_cell_bg(column, row, col) => table.cell_set_bgcolor(dashboard, column, row, col)
if barstate.islast and showDashboard
dashboard_cell(0, 0 , “EzAlgo”)
dashboard_cell(0, 1 , “Current Position”)
dashboard_cell(0, 2 , “Current Trend”)
dashboard_cell(0, 3 , “Volume”)
dashboard_cell(0, 4 , “Timeframe”)
dashboard_cell(0, 5 , “1 min:”)
dashboard_cell(0, 6 , “3 min:”)
dashboard_cell(0, 7 , “5 min:”)
dashboard_cell(0, 8 , “15 min:”)
dashboard_cell(0, 9 , “30 min:”)
dashboard_cell(0, 10, “1 H:”)
dashboard_cell(0, 11, “2 H:”)
dashboard_cell(0, 12, “4 H:”)
dashboard_cell(0, 13, “8 H:”)
dashboard_cell(0, 14, “Daily:”)
dashboard_cell(1, 0 , “V.5”)
dashboard_cell(1, 1 , trigger ? “Buy” : “Sell”, true), dashboard_cell_bg(1, 1, trigger ? color.green : color.red)
dashboard_cell(1, 2 , emaBull ? “Bullish” : “Bearish”, true), dashboard_cell_bg(1, 2, emaBull ? color.green : color.red)
dashboard_cell(1, 3 , str.tostring(volume))
dashboard_cell(1, 4 , “Trends”)
dashboard_cell(1, 5 , TF1Bull ? “Bullish” : “Bearish”, true), dashboard_cell_bg(1, 5 , TF1Bull ? color.green : color.red)
dashboard_cell(1, 6 , TF3Bull ? “Bullish” : “Bearish”, true), dashboard_cell_bg(1, 6 , TF3Bull ? color.green : color.red)
dashboard_cell(1, 7 , TF5Bull ? “Bullish” : “Bearish”, true), dashboard_cell_bg(1, 7 , TF5Bull ? color.green : color.red)
dashboard_cell(1, 8 , TF15Bull ? “Bullish” : “Bearish”, true), dashboard_cell_bg(1, 8 , TF15Bull ? color.green : color.red)
dashboard_cell(1, 9 , TF30Bull ? “Bullish” : “Bearish”, true), dashboard_cell_bg(1, 9 , TF30Bull ? color.green : color.red)
dashboard_cell(1, 10, TF60Bull ? “Bullish” : “Bearish”, true), dashboard_cell_bg(1, 10, TF60Bull ? color.green : color.red)
dashboard_cell(1, 11, TF120Bull ? “Bullish” : “Bearish”, true), dashboard_cell_bg(1, 11, TF120Bull ? color.green : color.red)
dashboard_cell(1, 12, TF240Bull ? “Bullish” : “Bearish”, true), dashboard_cell_bg(1, 12, TF240Bull ? color.green : color.red)
dashboard_cell(1, 13, TF480Bull ? “Bullish” : “Bearish”, true), dashboard_cell_bg(1, 13, TF480Bull ? color.green : color.red)
dashboard_cell(1, 14, TFDBull ? “Bullish” : “Bearish”, true), dashboard_cell_bg(1, 14, TFDBull ? color.green : color.red)
plot(showRevBands ? upperKC1 : na, “Rev.Zone Upper 1”, red30)
plot(showRevBands ? upperKC2 : na, “Rev.Zone Upper 2”, red30)
plot(showRevBands ? upperKC3 : na, “Rev.Zone Upper 3”, red30)
plot(showRevBands ? upperKC4 : na, “Rev.Zone Upper 4”, red30)
plot(showRevBands ? lowerKC4 : na, “Rev.Zone Lower 4”, cyan30)
plot(showRevBands ? lowerKC3 : na, “Rev.Zone Lower 3”, cyan30)
plot(showRevBands ? lowerKC2 : na, “Rev.Zone Lower 2”, cyan30)
plot(showRevBands ? lowerKC1 : na, “Rev.Zone Lower 1”, cyan30)
fill(plot(showRibbon ? ribbon1 : na, “”, na, editable=false), plot(showRibbon ? ribbon2 : na, “”, na, editable=false), ribbon1 > ribbon2 ? cyan30 : pink30, “Ribbon Fill Color”)
// Alerts
alert01 = ta.crossover(ribbon1, ribbon2)
alert02 = bull
alert03 = wtDivBull
alert04 = wtDivBear
alert05 = bull or bear
alert06 = ta.crossover(wt1, wt2) and wt2 <= -53
alert07 = ta.crossunder(wt1, wt2) and wt2 >= 53
alert08 = ta.crossunder(ribbon1, ribbon2)
alert09 = rsiOb or rsiOs
alert10 = bear
alert11 = ta.cross(ribbon1, ribbon2)
alerts(sym) =>
if alert02 or alert03 or alert04 or alert06 or alert07 or alert10
alert_text = alert02 ? “Buy Signal EzAlgo” : alert03 ? “Strong Buy Signal EzAlgo” : alert04 ? “Strong Sell Signal EzAlgo” : alert06 ? “Mild Buy Signal EzAlgo” : alert07 ? “Mild Sell Signal EzAlgo” : “Sell Signal EzAlgo”
alert(alert_text, alert.freq_once_per_bar_close)
alerts(syminfo.tickerid)
alertcondition(alert01, “Blue Trend Ribbon Alert”, “Blue Trend Ribbon, TimeFrame={{interval}}”)
alertcondition(alert02, “Buy Signal”, “Buy Signal EzAlgo”)
alertcondition(alert03, “Divergence Buy Alert”, “Strong Buy Signal EzAlgo, TimeFrame={{interval}}”)
alertcondition(alert04, “Divergence Sell Alert”, “Strong Sell Signal EzAlgo, TimeFrame={{interval}}”)
alertcondition(alert05, “Either Buy or Sell Signal”, “EzAlgo Signal”)
alertcondition(alert06, “Mild Buy Alert”, “Mild Buy Signal EzAlgo, TimeFrame={{interval}}”)
alertcondition(alert07, “Mild Sell Alert”, “Mild Sell Signal EzAlgo, TimeFrame={{interval}}”)
alertcondition(alert08, “Red Trend Ribbon Alert”, “Red Trend Ribbon, TimeFrame={{interval}}”)
alertcondition(alert09, “Reversal Signal”, “Reversal Signal”)
alertcondition(alert10, “Sell Signal”, “Sell Signal EzAlgo”)
alertcondition(alert11, “Trend Ribbon Color Change Alert”, “Trend Ribbon Color Change, TimeFrame={{interval}}”)
相关资源


暂无评论...